Dashboard Content
Data is collected in the field by field officers and entered into a data entry spreadsheet. These data are then pulled into the ReDSS dashboard in real-time.
The dashboard consists of four different views: a framework of indicators, a map, a compare frameworks view and a compare maps view. Users can change the data displayed for different populations, different years and different regions from the menu bar.
The dashboard has the following features, which are highlighted with red numbers and explanations below:
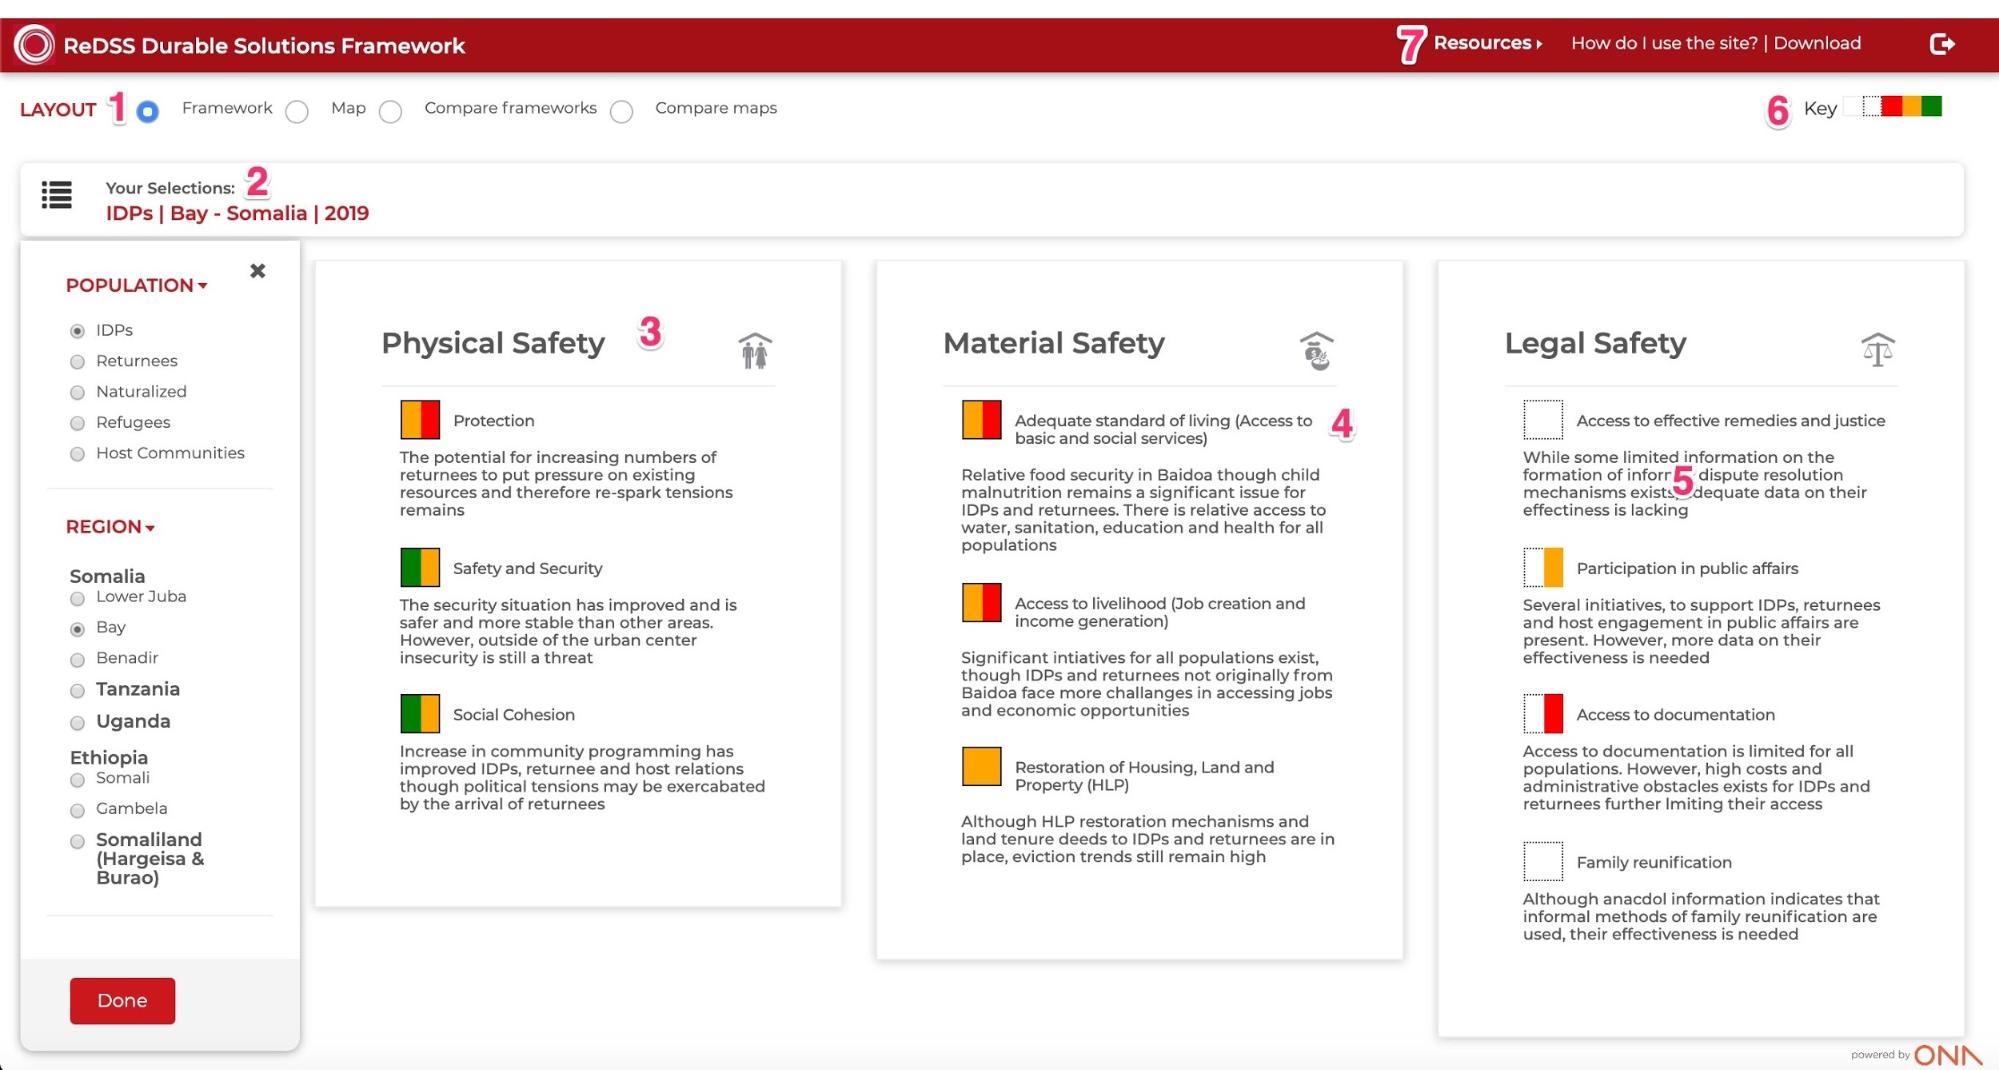
- Layout: This feature shows the different layouts of viewing the dashboard: the Framework, Map, Compare frameworks and Compare maps.
- Your Selection:This section shows the population, region and year you have selected. The image above displays data for an IDPs population in the Bay region of Somalia collected in 2019.
- Criteria:There are 3 criteria - physical safety, material safety, and legal safety
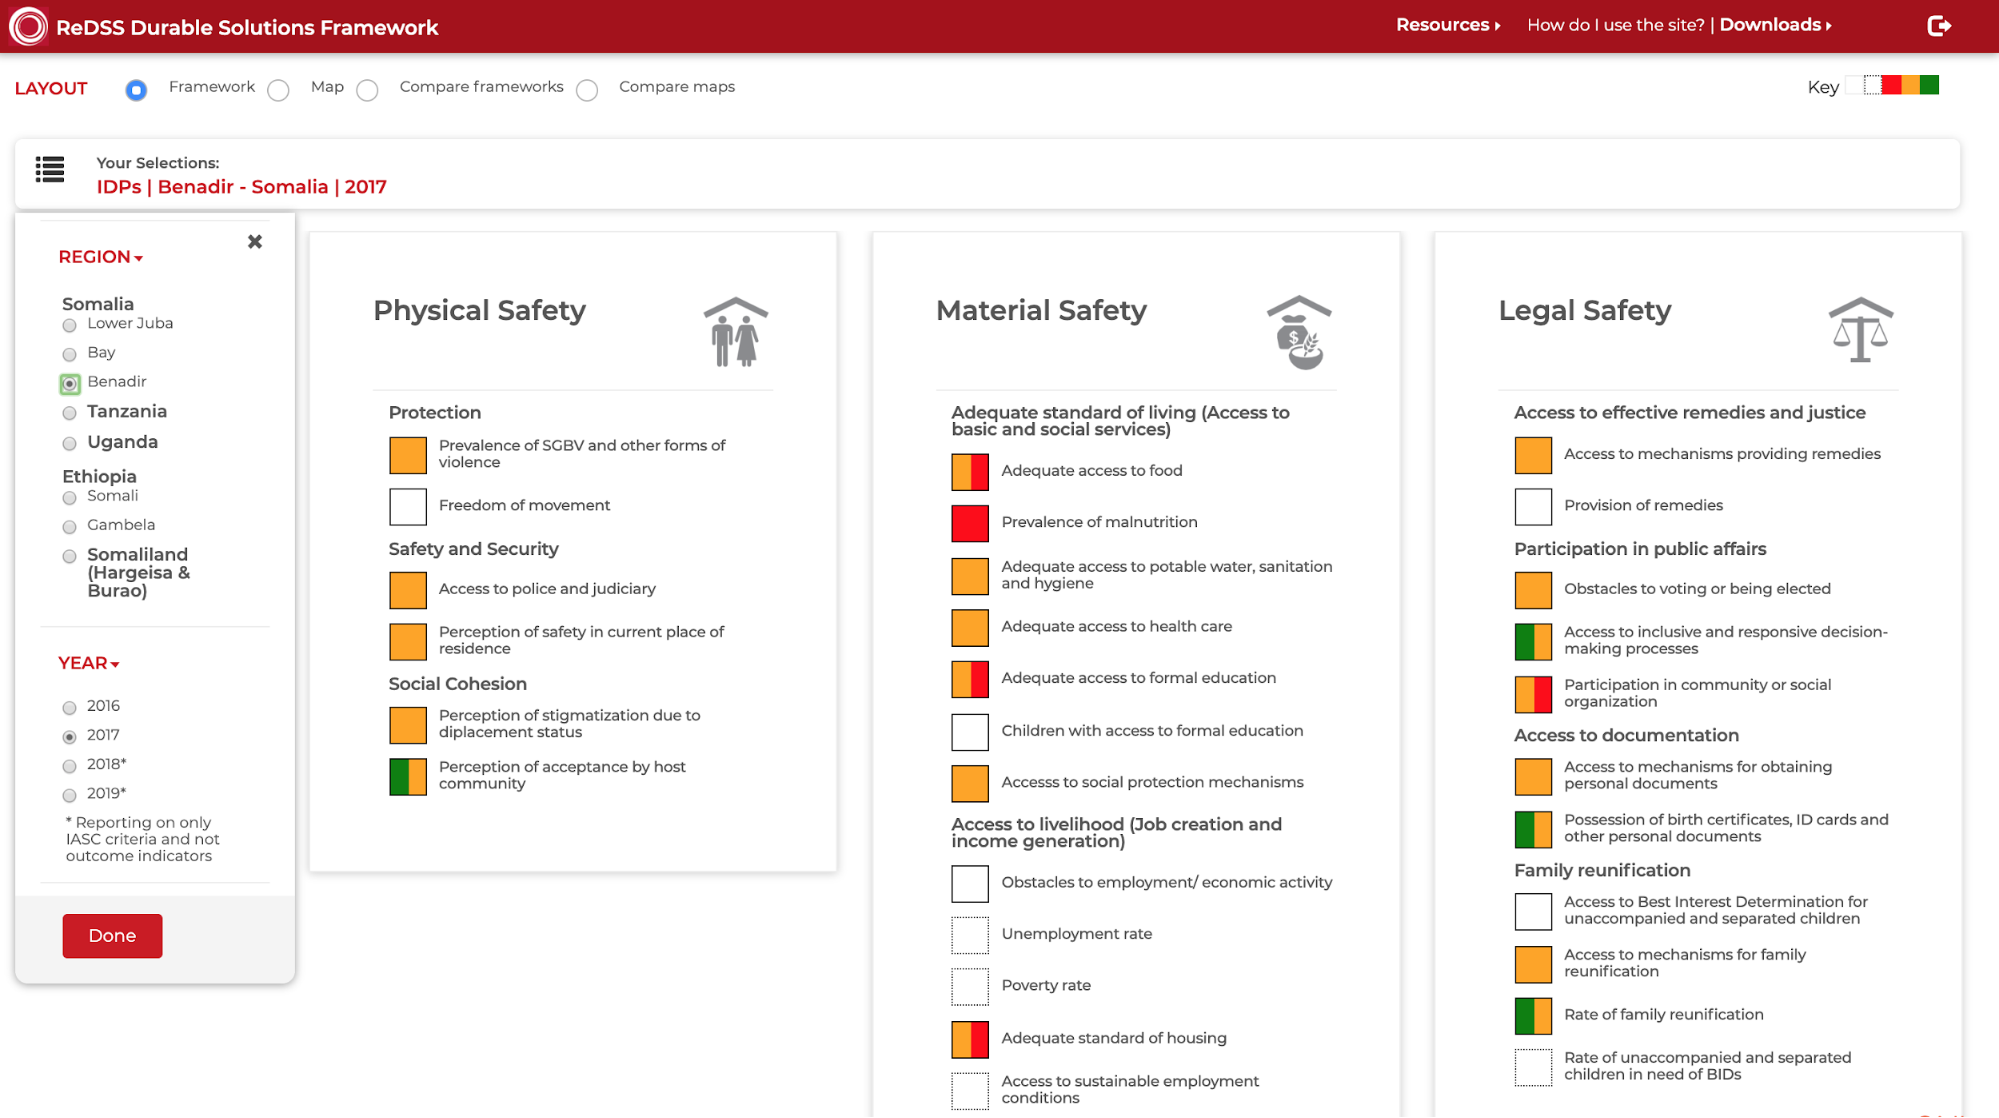
- Sub criteria: Each criteria is divided into different sub criteria and further into indicators. 2018 and 2019 data reports at the sub criteria level, while 2016 and 2017 data reports at the indicator level.
-
Summary Analysis: A summary analysis is provided for each sub criteria for 2018 and 2019 data. For 2016 and 2017 data, the framework lists the indicators under the sub criteria, instead of a summary analysis of the sub criteria as shown below.
-
Key: This is the key for the color coding. Hovering your mouse over it displays the key with the rating associated with each color.
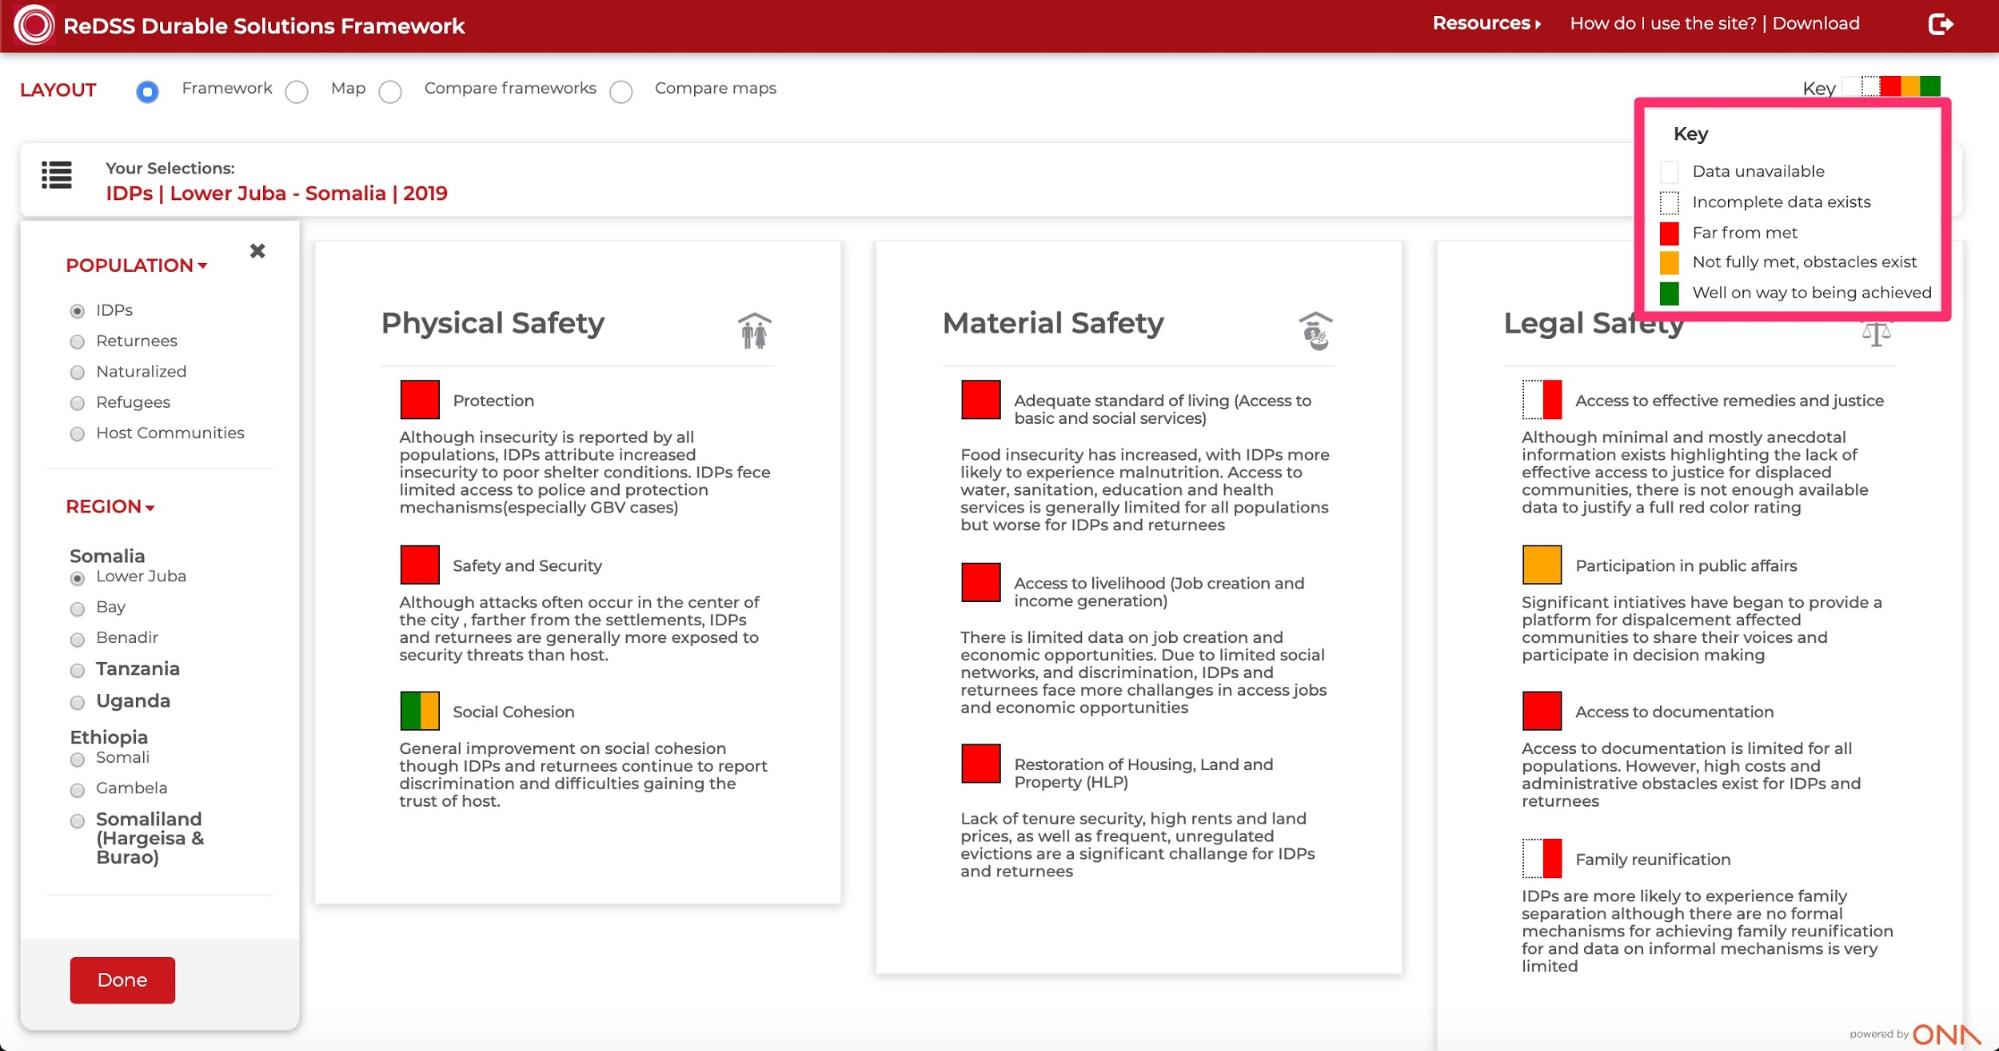
-
Links: Resources, How do I use the site? and Downloads links are found in this section:
Resources: Clicking this link displays a pulldown menu with templates that provide more information on the indicators. The templates are in PDF format and can be downloaded.
How do I use the site?: Clicking this link opens the dashboard’s user documentation in a new tab.
Downloads: Clicking this link displays a pulldown menu with solution analysis for Somalia, Somaliland, Ethiopia, Tanzania and Uganda. Clicking on a specific link opens the ReDSS website in a new tab and provides a full solutions analysis report for each region for the selected country, with options to download the reports.